We're a third of the way into the regular season already. As said in that text I sent you, I am very much enjoying the day to day matches. Every day is entertaining and a battle to watch who will win. I seek what you think about it. I mean, if you like it like I do, perhaps split up next year into two with a pair of chances to win the league. I'll come up with more specifics on how to work that depending on yourreception.

Looking at the table above, the hottest teams, Brad and Jordan have been on a bit of a tear. Chad has started his second losing streak. John Guttman snapped a 6 gamer yesterday too.
That's just a simple look. Anyway, contrary to what I said last week, I don't like the subjective power rankings. I love stats and excel and formulas. So why not just adapt the previous year's rankings and hybrid the formulas to adapt the day by day matchups that we are using this year and apply the changes. And so I did. The standings page is updated now and will reflect the full line of numbers, and the rankings below will also indicate that.
And hey look at that, Jordan is #1 for like the first time ever... Wait. What? Is that true? ... Hold on let me look at the history...
[Updating power rankings monitor sheet from a couple years ago]
Ok, so he has in fact ranked 1st. Once. Week 2 of 2014. He stayed relevant the entire year too mostly staying between 3rd and 6th. Since that point he came close in 2016 and 2017 hitting #2 a handful of times. Since then, ten of our current owners have touched 1st place. But with that being the case, let's keep in mind that Jordan was expected to be huge this year thanks to a complete redraft. I personally projected him to finish fourth in the post draft before the 'Rona was a thing...
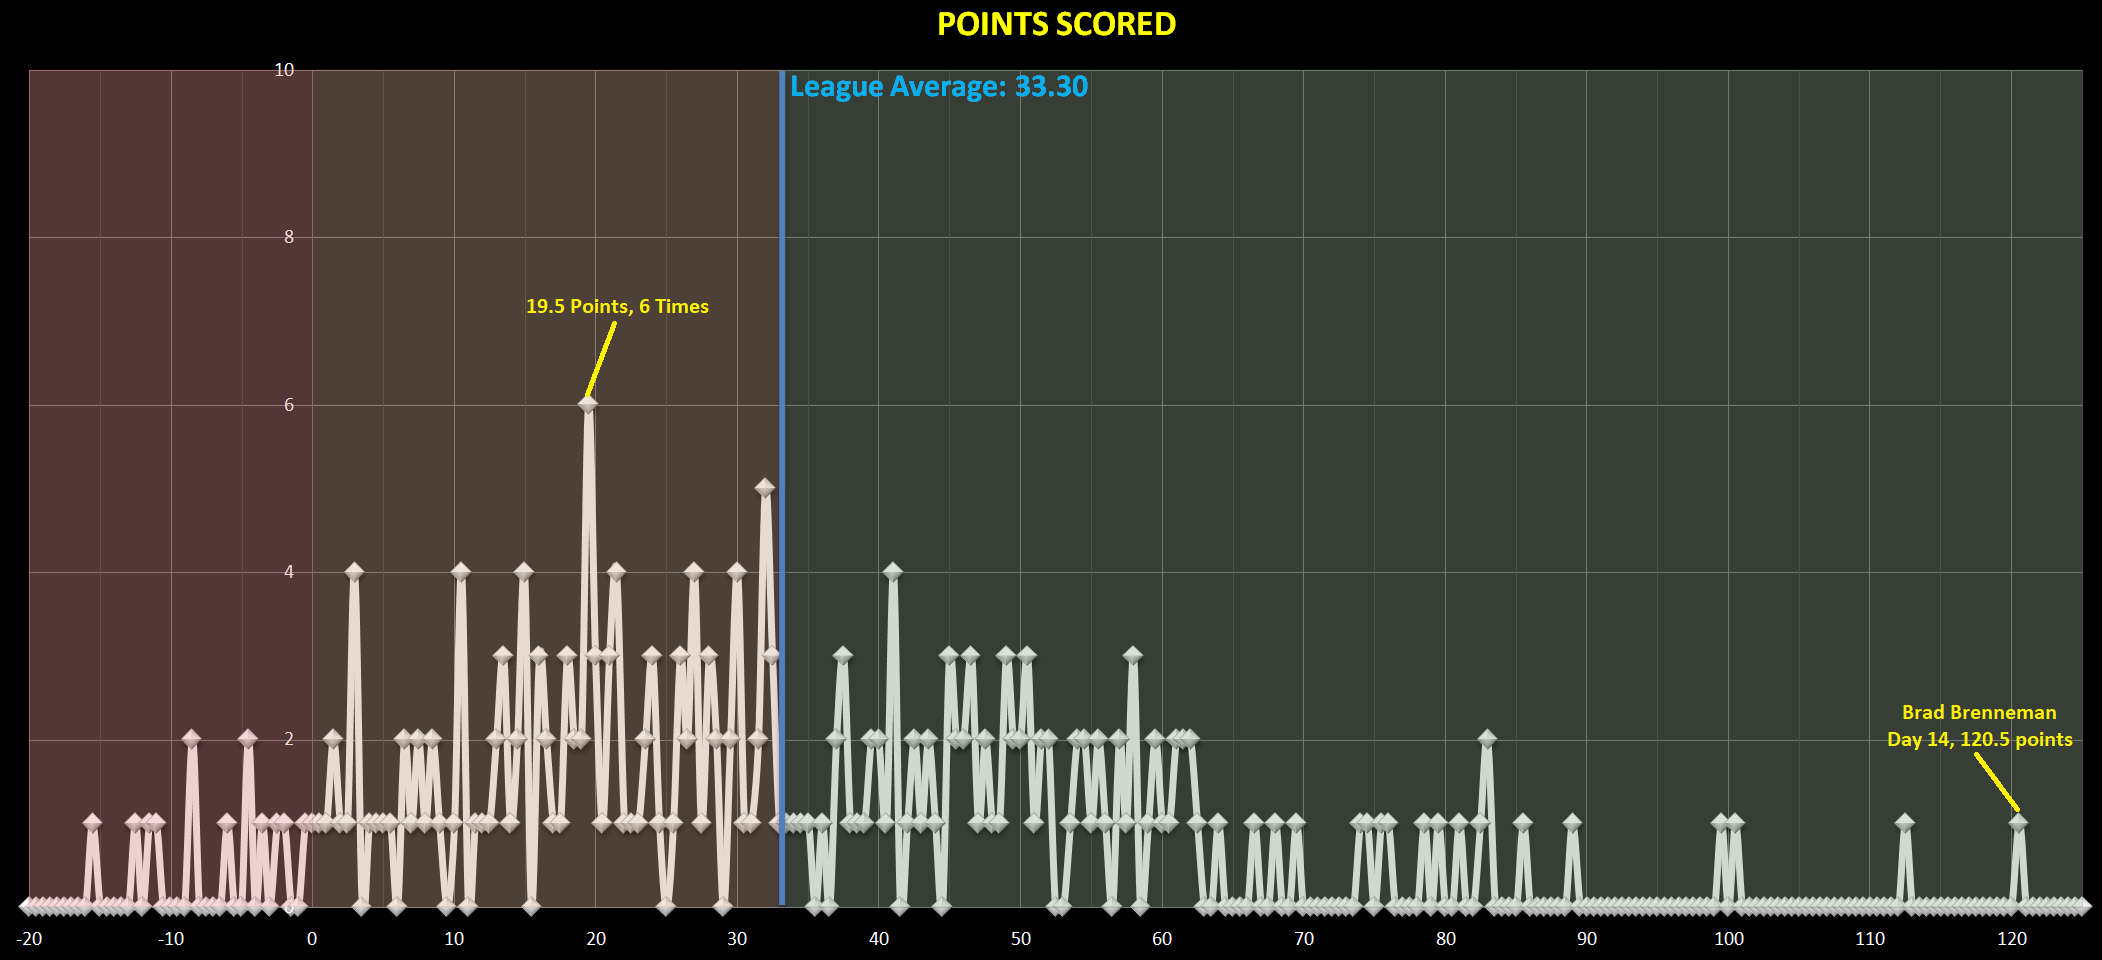
Anyway, Bradley has set a new high water mark for a single scoring day at 120.5. In season's prior we'd see around once a year a 150 point day. With our parameters this year, you can't easily have 5 starting pitchers go in one day. And even if you do, you lose a RP spot in the process. So realistically, this is the far upper limit we'll probably see.
In the graph below, the league average is still a little under 35 a day (for now). But most of the time, the score lands between 3 and 32. But I am surprised with the high number of negative days that have occurred.

Seriously, nearly 6% of the time someone is reaching negative points for a day. It seems pretty high considering you only need one or two guys to go off to get you into positive numbers... Oh well, I'm tired of typing... Read below...
AMERICAN LEAGUE| TEAM | REC | GB
| 1. | 12-5 | ---
| 2. | Rob Jones | 12-5 | ---
| 3. | Kyle Spector | 10-7 | -2
| 4. | Shon McCullough | 10-7 | -2
| 5. | Jeff Michaud | 9-8 | -3
| 6. | Tyler Kluge | 7-10 | -5
| 7. | John Bierkamp | 6-11 | -6
| | |||||
|---|---|---|---|---|---|---|---|---|---|---|---|---|---|---|---|---|---|---|---|---|---|---|---|---|---|---|---|---|---|---|---|---|---|---|---|
